Housing market predictions for 2026: What can buyers and sellers expect?
Contributed by Tom McLean, Grace Kang
Dec 11, 2025
•8-minute read

Thinking about buying or selling a home in 2026? You’re not alone. After several years of high mortgage rates, tight inventory, and affordability challenges, many Americans are asking the same question: Will the housing market finally start getting back to normal?
The short answer: Yes, but it will happen slowly.
According to the housing market outlook prepared by the Economics Team at Redfin1, a Rocket® company, the housing market in 2026 should begin a cautious recovery, with mortgage rates easing slightly, more homes hitting the market, and more Americans buying homes. Prices will increase more slowly than wages and inflation, making buying a home more affordable.
Still, the rebound won’t be uniform. Local economies, job markets, and migration patterns will continue to shape regional trends, metro trends, and nationwide housing trends.
Key takeaways:
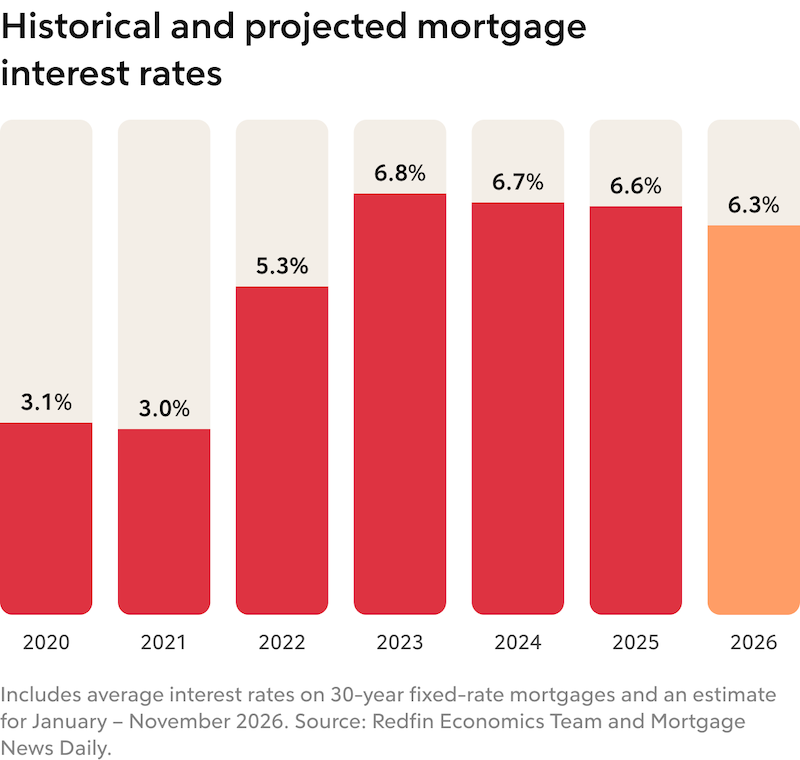
- The year 2026 will mark the start of a slow, steady housing recovery. Mortgage rates should continue their gradual decline, sitting in the low-6% range throughout the year.
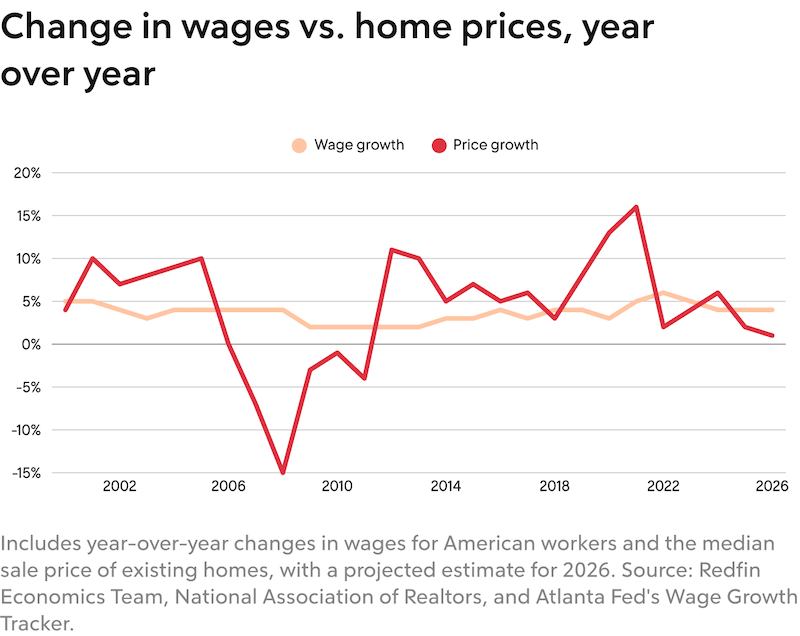
- Home prices will rise modestly. Prices are expected to increase about 1%, growing more slowly than wages for a sustained period for the first time in over a decade.
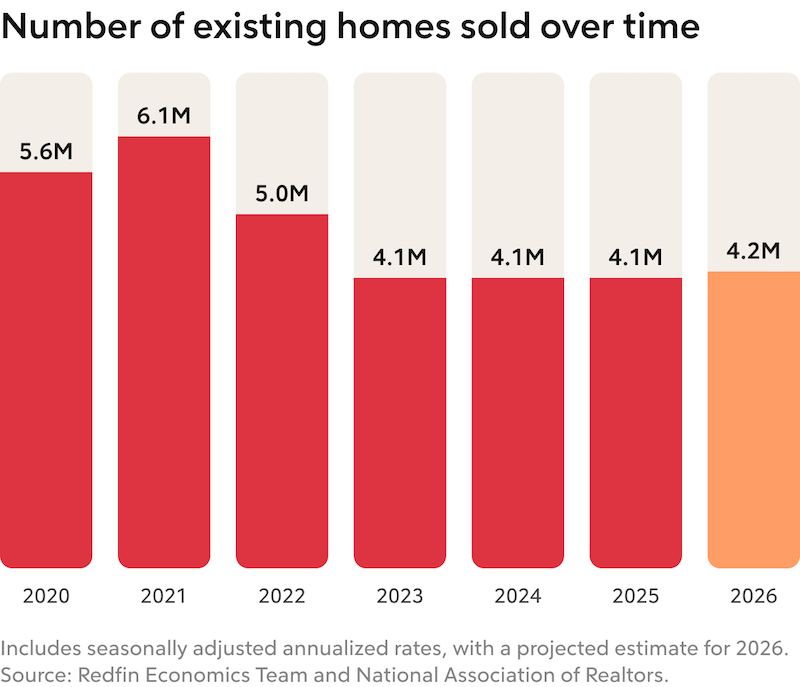
- Home sales will tick up. Existing-home sales should climb 3% year over year, as slightly better affordability will bring some hesitant buyers off the sidelines.
- Some markets will be hot. Metro areas near the Great Lakes and the suburbs of New York City are poised for stronger demand and price gains. Meanwhile, many once-hot Sun Belt “Zoom towns” will continue to cool as remote work fades and insurance costs rise.
A look back: 2025 set the stage for a gradual reset
To understand where the housing market is headed, it helps to look back at where it has been.
In 2025, mortgage rates mainly hovered between 6.5% and 7%, before falling to about 6.3% at the end of the year. High rates, along with widespread economic uncertainty related to inflation, tariffs, job insecurity, and recession jitters, kept many would-be home buyers on the sidelines and created a strong buyer’s market.
Some homeowners who locked in historically low pandemic-era rates chose to stay put, limiting the number of homes for sale. However, there were more new listings than in recent years, and new construction added to the supply in some areas.
Even though demand was tepid, prices kept rising in much of the country, which kept some house hunters from moving forward with a big purchase. The result was muted demand, persistent affordability challenges, and a housing market that’s ready, but not rushing, to recover.
Housing market forecast: 2026
Here’s what you can expect to see in the 2026 housing market.
Mortgage rates will ease, holding steady in the low-6% range
Average mortgage rates should hover around 6.3% in 2026, with the possibility of brief dips below 6% if inflation continues to cool. The U.S. Federal Reserve is expected to cut interest rates three times, which could have a strong economic impact and gradually improve borrowing conditions.
For buyers, that means a bit more breathing room, but rates aren’t expected to drop anywhere near the rock-bottom rates of the early 2020s. Home shoppers who get mortgage preapproval and compare multiple lenders will still have the upper hand when it comes to finding the best deal, as the buyer’s market is likely to continue into 2026.
Home prices will tick up 1% nationwide
Expect the median U.S. home sale price to increase about 1% year over year in 2026, signaling stability rather than a surge.
Buying a home will become a bit more affordable because prices will grow more slowly than wages for a significant period, for the first time since the aftermath of the 2008 financial crisis. The tiny price increase, combined with lower mortgage rates, means average mortgage payments will grow slower than wages, too.
Historically, slow demand has caused home prices to fall, but we don’t expect that in 2026. That’s largely because we expect some homeowners will choose to stay put rather than sell their home next year as they wait for market conditions to improve more.
Home sales will increase slightly
Sales of existing homes nationwide are predicted to end 2026 up 3% from 2025, coming in at an annualized rate of 4.2 million.
Overall, sales should increase slightly because affordability will improve just enough to lure some on-the-fence buyers. Still, sales will be limited by a slow labor market and stalled economic growth, including the Americans who have lost their jobs as AI takes a toll on white-collar employment opportunities.
Housing inventory will gradually build up
The total supply of U.S. homes for sale is expected to increase modestly in 2026. Some homeowners will choose to list as mortgage rates stabilize and affordability improves a bit.
But inventory levels won’t surge. Many homeowners will decide against selling into a buyer’s market. Some will list their homes, then pull them off the market if they don’t get the price they want. Other homeowners will opt to stay put, borrowing equity to renovate and meet other needs, rather than move while mortgage rates are still above 6%. Some families will remodel homes to comfortably accommodate multiple generations: Picture a garage converted into an accessory dwelling unit (ADU) for adult children who can’t yet afford to purchase their own home and are moving in with their parents.
Markets in the Great Lakes region, New York suburbs will be hot, while markets in Zoom towns will not
The housing market recovery will vary from region to region. Redfin expects relatively affordable metros in the Great Lakes region and the New York suburbs to experience stronger home buying demand and higher price growth than many other parts of the country.
Markets expected to heat up the most include New York City suburbs. Look to Long Island, the Hudson Valley, northern New Jersey, and Fairfield County, Connecticut. Other markets on the rise include Syracuse, New York; Cleveland; St. Louis; Minneapolis; and Madison, Wisconsin.
Once-hot pandemic boomtowns in the Sun Belt may continue to cool as the era of remote work fades and climate-driven natural disasters – along with the resulting surge in homeowners insurance costs – make would-be buyers think twice.
Here’s where we expect housing markets to cool down the most: Nashville, Tennessee; San Antonio; Austin, Texas; Fort Lauderdale, Florida; West Palm Beach, Florida; and Miami.
See what you qualify for
Should you buy a house in 2026?
If you’ve been waiting for better conditions, 2026 could be a good time to buy, especially if rates fall below 6% and more homes are listed. But your decision about whether to buy a house next year, and how successful you are at finding one that fits your budget and preferences, will depend on preparation and strategy.
Tips for buyers
- Check your credit score. A higher credit score can help you qualify for lower rates.
- Save for a down payment. If you can afford a larger down payment, you can borrow less and reduce your monthly payment.
- Compare loan options. Look into fixed-rate vs. adjustable-rate mortgages to figure out what fits your goals. Some home buyers also may consider government-backed options, like FHA loans and VA loans.
- Get preapproved for a mortgage. Mortgage preapproval shows listing agents and sellers that you’re ready to buy.
- Know your budget. Factor in property taxes, homeowners insurance, homeowners association fees, and maintenance costs.
- Know your must-haves versus your nice-to-haves. Create a short list of nonnegotiables, like location, layout, and commute time. Be open to flexibility in the home's cosmetic features.
- Be ready to act fast. Well-priced homes will likely attract multiple offers. Make sure you’re prepared with your strongest offer, which includes not only the price you’re willing to pay for the home, but also whether you’re willing to waive any contingencies and whether you’re able to close the deal quickly.
- Stay calm, cool, and collected during negotiations. Counteroffers, requests for a faster closing, and other requests from sellers are normal. Remember to focus on buying and closing on a home that meets your needs – and those of your family – at a fair price.
Is 2026 a good time to sell a home?
For homeowners sitting on equity, 2026 could be a good time to sell. Stable prices and slightly lower rates may bring more buyers back into the market, particularly in growing metros with strong job opportunities.
But the right time to sell a house is when the homeowner is ready. Whether you should sell your home in 2026 depends not only on market conditions, but also on personal circumstances and whether you want or need to move.
Tips for sellers
- Work with a real estate agent. They can help you price your home competitively and market it effectively.
- Get an appraisal and price your home right from Day 1. Knowing your home’s value up front sets realistic expectations. A home that’s reasonably priced signals to buyers that they’re getting good value for their money and has a better chance of sparking competition. A real estate agent can help you set a realistic price using market comps.
- Focus on simple upgrades. Paint, curb appeal, deep cleaning, and energy-efficient improvements often deliver the best return.
- Stage for your target buyer. You may not need full-fledged professional staging, but neutral, lightly styled spaces make potential buyers feel welcome and help them picture themselves in the home.
- Invest in high-quality listing photos and videos. Most house hunters see your home online first. Good photos and videos can drive traffic and improve your home’s perceived value.
- Be flexible with showings. The more people who see your home, the more likely it is to sell. This is especially important in a market with more home sellers than buyers.
- Be strategic about timing. If you live in a seasonal market, talk to your real estate agent about the best time of year to list your home to get top dollar.
- Be open to negotiations. Offers may include contingencies and requests for repairs or lender credits toward closing costs. The fastest path to closing is often working with serious buyers to find a middle ground.
Take the first step toward the right mortgage
Apply online for expert recommendations with real interest rates and payments
FAQ
Here are answers to common questions about what to expect in the housing market in 2026.
Will home prices go down in 2026?
Forecasts from most real estate experts, including those at Redfin, expect small price gains of about 1% as supply and demand rebalance.
Will the housing market be better in 2026 than it was in 2025?
Gradually, yes. Buyers may find more homes for sale and slightly lower interest rates, while sellers can expect to benefit from stabilized pricing, along with the same lower rates that benefit buyers.
Will buying a home be more affordable in 2026 than it was in 2025?
Yes, experts expect that buying a home will become a bit more affordable next year. That’s because home prices will grow more slowly than wages and inflation, and mortgage rates will be lower in 2026 than in the previous few years.
Should I sell my house in 2026?
If you’ve built equity or plan to move based on personal circumstances, 2026 could be a smart time to list – just don’t expect dramatic price jumps.
What will mortgage rates be in 2026?
Rates are projected to hover near 6.3%, dipping closer to 6% if inflation improves faster than expected.
The bottom line: A steadier market, but timing is personal
The 2026 housing market is shaping up to be more balanced than the roller-coaster years that came during and right after the pandemic. Prices should grow modestly, mortgage rates may ease slightly, and buyers will have a bit more room to breathe.
Still, the best time to buy or sell is when it aligns with your financial goals and life plans – not just market timing.
1Rocket Mortgage is an affiliate of Redfin. You aren't required to use its lending services. Learn more at redfin.com/afba.
Rocket Mortgage, LLC, Rocket Homes Real Estate LLC, Rocket Card, LLC, RockLoans Marketplace LLC (doing business as Rocket Loans), and Rocket Money, Inc., are separate operating subsidiaries of Rocket Limited Partnership. Redfin Corporation is an affiliated business of Rocket Limited Partnership. Each company is a separate legal entity operated and managed through its own management and governance structure. Rocket Limited Partnership is an indirect, wholly owned subsidiary of Rocket Companies, Inc. (NYSE: RKT).

Dana Anderson
Dana Anderson is a principal data journalist at Redfin, where she has been writing about the numbers behind real estate trends since 2018. She writes data-driven reports about the relationship between mortgage rates and home buying demand, how economic events impact the housing market, and much more.
Related Resources
3-minute read
Federal Reserve statement explained – June 2026
The target for the federal funds rate remained unchanged today in the range of 3.5% – 3.75%. There were also projections released from Fed officials.
Read more
1-minute read
What is Rocket.com?
Rocket.com creates a seamless experience to find, buy and manage your home in an easy-to-use, AI-driven platform, simplifying your homeownership journey.
Read more

4-minute read
Homeowners are significantly more likely than renters to love where they live
Roughly 3 in 5 U.S. homeowners (59%) are very satisfied with their living situation, compared with just 34% of renters, according to a recent survey.
Read more